top of page


2D Thermal Maps


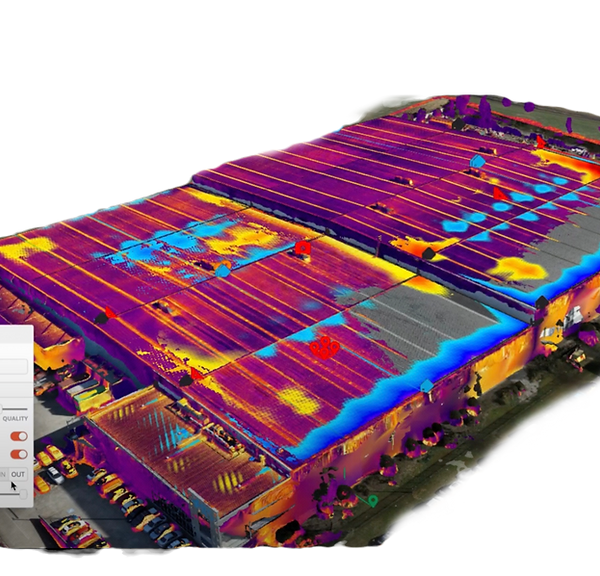
Blue Feather Thermal 2D Maps provide a comprehensive view of the city’s heat signature, revealing temperature variations across surfaces. These detailed maps identify urban heat islands, showcasing hotspots such as rooftops, asphalt, and industrial areas. Enhanced with data on vegetation and cooling effects, our maps drive targeted strategies for heat mitigation, energy efficiency, and public health.
2D Thermal Map


bottom of page